Shorts Video Analysis: 7 Metrics That Beat Likes & Views
Stop chasing vanity metrics. Our guide to Shorts video analysis reveals the 7 data points that truly matter to the YouTube algorithm. Learn how to audit your videos today.
What if we told you that 100,000 views on your YouTube Short could be worse than 10,000? It sounds wrong. But in the world of 2026 social media algorithms, it's a hard reality. We're trained to measure success with likes and the view counter. It's simple, clean, and feels good for the ego. However, these numbers are just the tip of the iceberg, and they often lie.
The real magic is buried deeper. It’s in the percentages, seconds, and behavioral signals that 90% of creators ignore. This is the data that tells the algorithm whether to push your content to millions or leave it on the digital roadside. And this is the data we're talking about today. Not likes. But what actually matters.
Why traditional metrics are misleading
Are views and likes completely useless? Not entirely, but they are classic “vanity metrics.” They look good on the surface but say very little about the actual effect of your video. The YouTube Shorts algorithm is optimized for one primary goal: to keep a user on the platform for as long as possible. A single like is a millisecond action. But a person re-watching your video or visiting your channel after a Short is a powerful signal that your content is genuinely engaging.
Imagine this scenario. Your 30-second video gets 50,000 views and 2,000 likes. Sounds decent. But your analytics show the average view duration is just 8 seconds. This means most people swiped away before even hitting the one-third mark. To the algorithm, that's a red flag. On the other hand, another video gets only 15,000 views but has an average view duration of 35 seconds—over 100% of its length. This means people are watching it again and again. Which video do you think YouTube will show to a wider audience?
The answer is obvious.
This is why a deep shorts video analysis is so important. It lets you see the whole picture, not just the attractive but uninformative part. We need to shift our focus from asking, “How many people saw this?” to “What did people do after they saw this?”
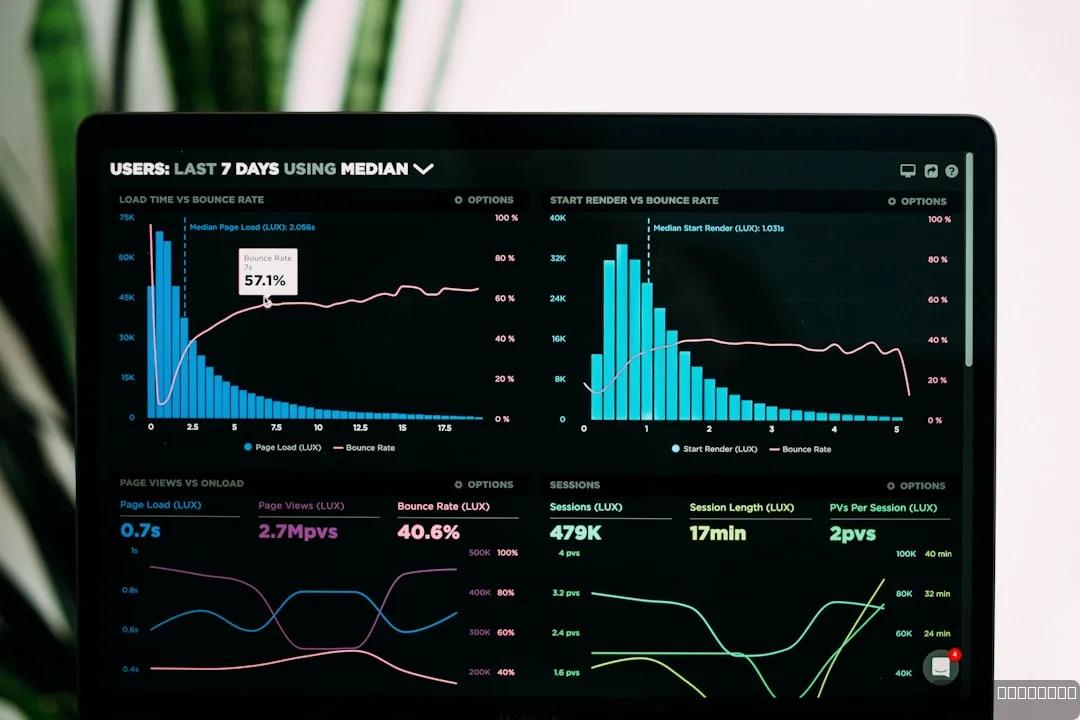
Photo by Deng Xiang on Unsplash

The 7 key metrics for a deep shorts video analysis
When you open YouTube Studio, you’re hit with a wall of graphs and numbers. It's easy to get lost. To prevent that, we’ve pinpointed 7 metrics you should check first. They fall into two groups: retention and engagement.
Audience retention metrics
This is the foundation. If you can't hold a viewer's attention, nothing else matters.
1. Viewed vs. Swiped Away
This might be the single most important metric for Shorts. It shows how many people who were shown your video in the feed actually watched it versus swiping away immediately. According to 2025 data from TubeBuddy, Shorts with a “Viewed” percentage above 85% have a much higher chance of hitting a viral loop. If your number is below 70%, it’s a sign that your hook or the main part of your video isn’t working. It's the first indicator telling you, “Hey, there’s a problem here, dig deeper.”
2. Average View Duration (AVD)
You must analyze this metric as a percentage of your video's total length. If your video is 20 seconds long and the AVD is 18 seconds (90%), that's a strong result. But if your video is 60 seconds long and the AVD is only 25 seconds (about 42%), that's a poor signal. The ideal target is 100% or more. A score over 100% means viewers are re-watching your content, which is an extremely positive signal for the algorithm.
3. Audience Retention Graph
This is your video’s X-ray. The graph shows you the exact moment viewers lose interest and swipe away. Look for sharp drops. Did you say something boring at the 5-second mark? Or did the visuals become static? Also, look for small bumps in the graph—these are moments people re-watched. Analyze what happened in those spots and try to replicate that effect in future videos. A proper Shorts Video Audits: Why Sentiment Beats Likes always begins with this graph.
Engagement and behavior metrics
Once you've held their attention, the next step is to inspire action.
4. Comment-to-Like Ratio
A like is a passive action. A comment requires effort. You have to think of something to say and type it out. Because of this, the algorithm values comments far more than likes. We think a good goal is a ratio of at least 1 comment for every 100 likes. If you have 5,000 likes but only 10 comments, your video was likely visually pleasant but didn't provoke any thoughts or emotions. But 500 likes and 50 comments? That’s a sign of content that sparks a conversation.
5. Number of Remixes
Remixes are when other creators use the audio from your Shorts. This is one of the most underrated metrics. It shows YouTube that your content isn't just being consumed; it's inspiring others to create. It is the highest form of a digital compliment. If people start remixing your videos, you're on the right track to starting a trend.
6. Channel Page Visits from Shorts Feed
Did your video interest a viewer enough for them to want more? This metric answers that question. A high number of channel page visits means your Short is working as an effective storefront for your entire channel. It turns casual viewers into potential subscribers. It’s a bridge from discovery to community.
7. Returning Viewers from Shorts
This is your key to the algorithm.
YouTube wants to build communities, not just show one-off viral clips. When the same people come back to watch your new Shorts, it signals to the platform that you are creating a loyal audience. This is the hardest metric to move, but it's the one that ensures long-term, stable channel growth instead of short-lived popularity spikes.
How to run your own shorts video audit
What's the best way to apply all this theory? Here’s a simple, step-by-step plan for auditing your own content.
- Open YouTube Studio. work through to the 'Analytics' section, then the 'Content' tab, and select 'Shorts'.
- Choose a video to analyze. Don't pick a video with 200 views. Select ones that have at least 5,000–10,000 views, or choose a video you thought had high potential but didn't take off. These are where you'll find the most valuable insights.
- Check the retention graph first. Look closely at the first 3-5 seconds. Is there a massive drop-off? If 90% of viewers are gone by second 3, your hook failed. Period. Understanding what makes a hook work is a science, as we broke down in our AI for Marketers: Deconstructing a 6M View Video Formula.
- Read all the comments. Don't just look at the number. What emotions are people expressing? What questions are they asking? This is direct feedback from your audience. Your next video idea is probably hiding in there. Using AI to generate a script based on these comments is a pro move, and you can learn how in our ChatGPT for TikTok guide, with tips that apply to Shorts too.
- Compare its metrics to your most successful Short. Open the analytics for two videos side-by-side. What's different? The length? The topic? The music? The structure? Often, the secret to success is hidden in small details you can only spot with a direct comparison.
Photo by TheRegisti on Unsplash

3 mistakes 90% of creators make when analyzing shorts
Did you know you can look at all the right data and still draw the wrong conclusions? It happens when creators fall into common thinking traps. Here are the three most frequent mistakes we see.
- Drawing conclusions in the first 24 hours. The Shorts algorithm has a “long tail.” A video can suddenly take off a week or even a month after being published. Give it time. Analyze data over a 7-day or 28-day period, not just the first day.
- Ignoring negative signals. It’s easy to celebrate high view counts, but it’s vital to be honest about a low retention rate. If 80% of people swipe away in the first 5 seconds, you have a problem that can't be ignored, even if the video got 1 million views from an aggressive initial push.
- Comparing yourself to creators in other niches. What works for entertainment sketches won't work for educational content. The average retention rate in a “DIY life hacks” niche will almost always be higher than in a “tech news” niche. Compare yourself only to your past performance and your direct competitors.
But, on the other hand, a single video's poor performance isn't always a reflection of its quality. Sometimes the algorithm just doesn't find the right audience immediately. This is why looking at trends over 5-10 videos is more useful than obsessing over one flop. Analysis is a marathon, not a sprint.
Shifting from a surface-level glance at likes to a deep analysis of behavioral metrics is a change in mindset. It's the path from an amateur hoping for luck to a professional working with data. It might seem complex, but every step in this direction makes your content strategy stronger. And this approach is what separates channels growing by 1,000 subscribers a month from those growing by 100,000. Start analyzing your Shorts correctly today, and you will see the difference. Find more strategies and breakdowns on our blog.
Try Clipwise for free
AI finds TikTok trends, analyzes videos and generates ideas. Starter tokens are free.
Create account
Sofia Melnyk
Growth Marketing & Analytics @ Clipwise